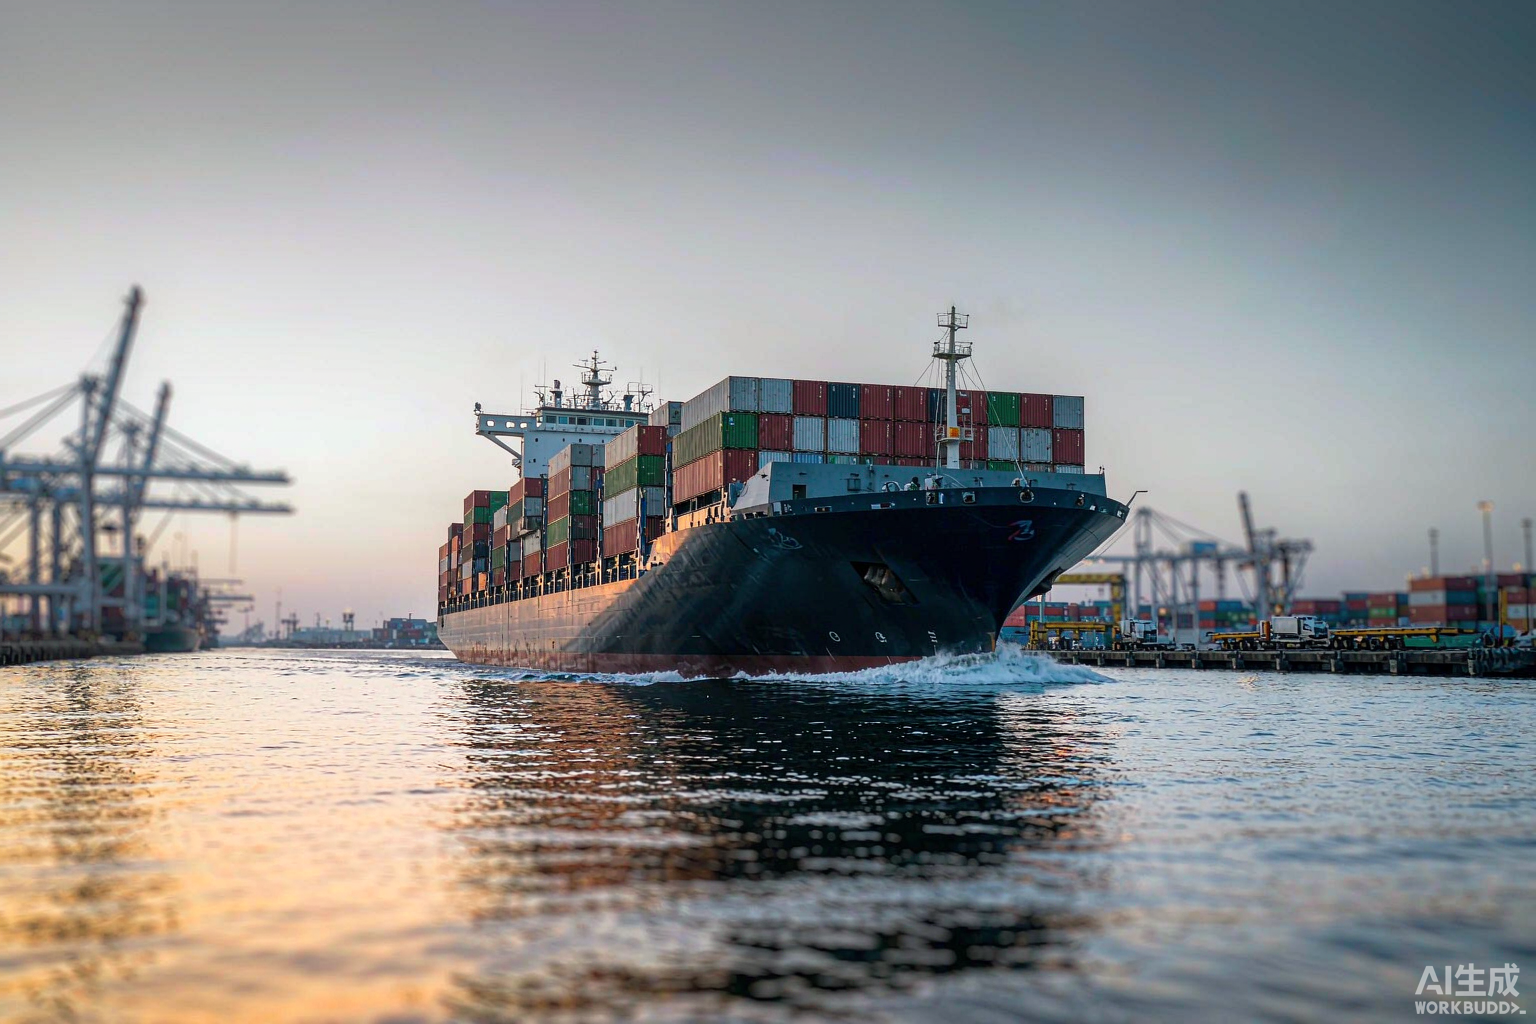
Since 1 January 2026 the EU shipping carbon allowance regime has moved to 100% surrender, turning that “ETS” line on the freight invoice into a landed cost item that must be calculated. This article separates EU ETS from FuelEU Maritime: the surrender ratios, the 100%/50% geographic rule, the wider CO2e basis, allowance pricing and allocation methods, plus FuelEU’s penalty and flexibility mechanisms. It then sets out the October 2026 market reality — the Suez return, softening rates, reliability falling to 49.9% — and how Cape routing inflates carbon cost, closing with eight checks buyers can run immediately.
On 1 January 2026, the EU shipping carbon allowance regime moved to 100% surrender. That line on your freight invoice labelled “ETS”, “EUA” or “emissions” — small enough to ignore for the past two years — has now become a landed cost item you have to take seriously. And by coincidence, in late September and early October 2026, Red Sea routings are returning fast, the freight index has ended an eight-week run of gains, and carriers have filed a fresh round of October surcharges. The market is re-pricing route by route, not simply getting cheaper.
This article separates two things that are easily confused: how the carbon surcharge is calculated, and what has actually changed in ocean freight as of October 2026. For anyone exporting or importing shading fabric, coated fabric or upholstery fabric, both land directly in your quotation.
1. First, separate them: EU ETS and FuelEU are two different mechanisms
Many forwarders now bundle the two costs into a single “emissions surcharge” line. The invoice looks cleaner, but you can no longer see what you are paying for. They are fundamentally different:
- EU ETS (Emissions Trading System) is cap-and-trade: shipping companies must buy and surrender allowances (EUAs) for every tonne of in-scope emissions. It governs absolute emissions.
- FuelEU Maritime governs the greenhouse gas intensity of the fuel — how many grams of CO₂ equivalent are emitted per unit of energy, measured on a full well-to-wake lifecycle basis. It sets no cap; instead it tightens an intensity limit year by year, with a penalty for non-compliance.
On a single voyage, both rules apply and the costs stack. In a negotiation you need to know how much each one is.
2. EU ETS: four key numbers and the geographic rule
- Surrender ratio: 40% in 2024, 70% in 2025, and 100% from 2026. The phase-in is over, and that is the direct reason surcharges rose sharply in 2026.
- Geographic rule: emissions on voyages between two EU/EEA ports count at 100%, and this includes emissions while at berth in an EU port. On voyages between an EU port and a non-EU port, only 50% counts. So on Shanghai to Hamburg, only half the emissions fall within ETS scope.
- Wider measurement basis: the scheme now measures CO₂ equivalent (CO₂e), which already includes methane (CH₄) and nitrous oxide (N₂O), not CO₂ alone. That pushes real numbers above early estimates.
- Allowance price: EUAs are market-traded, so the surcharge floats with the price. The monthly average for 20 July to 20 August 2026 was about EUR 81.5 per tonne, having spent most of the period in the EUR 75–80 range. The figure circulating in the industry of roughly USD 168 per container is a reasonable order of magnitude; the real number depends on lane, vessel and the prevailing allowance price.
The scope applies to vessels of 5,000 gross tonnage and above. For a cargo owner, the practical implication is that switching to a smaller carrier will not let you avoid it.
3. FuelEU Maritime: the penalty and three flexibility mechanisms
- Baseline and tightening path: starting from a 2020 baseline of about 91.16 gCO₂e/MJ, the required reduction is 2% for 2025–2029, 6% for 2030–2034, 14.5% for 2035–2039, and 80% by 2050.
- Penalty: non-compliant energy is charged at EUR 2,400 per tonne of VLSFO equivalent, and the penalty escalates for consecutive years of non-compliance. It is one of the most expensive single environmental penalties in shipping.
- Flexibility: the rules allow pooling, banking and borrowing — an efficient vessel can transfer surplus compliance balance to a less efficient one, or shift it between years. Carriers therefore have technical levers to lower their overall compliance cost, which also means the surcharge logic differs between lanes for the same carrier.
- Shore power and future fuels: the rules encourage shore power use at EU ports, and from 2034 require vessels to use at least 2% renewable fuels of non-biological origin.
4. Why two cargo owners on the same voyage see different numbers
This is where buyers most often lose money. Four variables create the spread:
- Vessel efficiency. A newer, larger vessel steaming slower emits less per container, so its cost to recover is genuinely lower. Carriers with younger fleets have a real advantage here.
- Routing. A Cape of Good Hope leg burns more fuel, which raises the emissions that fall into ETS scope — the most easily overlooked element of the hidden cost of diversion.
- Allocation method. Voyage cost is divided across the cargo, commonly per TEU, by weight, or on a blended basis. Per-TEU allocation favours heavy cargo; weight-based allocation favours light, voluminous cargo. Fabric is a classic light-and-bulky product, so you must ask which method applies to you.
- Whether FuelEU is bundled in. Bundling makes the invoice simpler but leaves you unable to see how much each mechanism actually costs.
5. The October 2026 reality: the Red Sea return and softening rates
This is the part that most needs updating. As of early October 2026, several clear shifts have occurred:
- The Suez return is now structural. Since May, more than 140 containerships representing just over 2 million TEU have switched from Cape of Good Hope routings back to Suez. Last week was the busiest week for containership transits through the Suez Canal since 2024, with 30 vessels of over 4,000 TEU passing through.
- Major carriers are moving decisively. COSCO and OOCL operated their first westbound Suez voyage in more than two years on 4 October with the 24,188 TEU OOCL SPAIN. The Premier Alliance (ONE, HMM, Yang Ming) is moving its FE1 service back to Suez, with ONE Continuity scheduled to depart Laem Chabang in mid-to-late October. Maersk and Hapag-Lloyd of the Gemini alliance are also increasing Suez transits. Maritime Strategies International estimates that around 35% of Asia–Europe sailings now use the Red Sea route.
- Rates have softened, concentrated on Europe. Freightos data showed Asia–North Europe spot rates down 9% to USD 3,376 per FEU and Asia–Mediterranean down 7% to USD 3,620. On Xeneta’s measure, Asia–North Europe spot rates have fallen 29% since 1 July to USD 1,590 per FEU and the Mediterranean 38% to USD 2,650. At the same time carriers are aiming to restore rates to USD 4,000–4,200 per FEU in late October, on top of a fresh round of October surcharges on South Africa, East Africa and Gulf services.
- Reliability is getting worse, not better. In August 2026 global liner schedule reliability fell 5.9 percentage points to 49.9%, the weakest since September 2022, while the average delay for late vessels rose 0.60 days to 6.81 days, the longest since March 2022. Looser capacity does not mean stable lead times, and that is critical for procurement planning.
- Capacity supply pressure is enormous. The containership orderbook has swelled to about 15.6 million TEU, roughly 45% of the fleet in service and a record, while port congestion is holding up about 3.76 million TEU, or 10.9% of the global fleet.
- The security picture remains layered. The posture as of 4 October: the Suez Canal is normal, Bab el-Mandeb is elevated, the southern Red Sea (Hodeidah approaches) is high, and the Gulf of Aden is elevated. The EU’s Aspides naval mission has said it does not have enough vessels to meet all escort requests, which is the main obstacle to a fuller return to Suez. There have also been reports that the Houthis communicated through diplomatic channels on 10 September that they would not attack European cargo ships, but the market is still returning in stages rather than in one step.
- Do not mistake a short window for a trend. Golden Week itself will make the next fortnight look soft. Wait until after the holiday to judge direction. One caveat: rates and security conditions change daily. The above is there to help you understand the structure, not to replace the quote you receive on the day.
6. Three things never to confuse
- EU ETS covers fuel emissions from shipping, not the carbon embedded in your goods.
- CBAM covers the embedded carbon in the goods themselves, with its own calculation and its own declarant obligation. When exporting fabric, keep the two entirely separate in your cost model.
- The global IMO framework has not landed. The IMO Net-Zero Framework was adjourned for a year at the October 2025 extraordinary MEPC session by 57 votes to 49, with talks expected to resume around October 2026. A global carbon price on shipping should therefore be treated as a 2027–2028 planning assumption, not a 2026 cost. Separately, the UK operates its own ETS with its own maritime scope, so voyages touching UK ports need to be checked independently.
7. Eight things a buyer can do now
- Separate the emissions surcharge from base freight in your cost tracking, so you can see it move independently rather than hide inside a total.
- Ask your forwarder for a per-container figure with the calculation basis stated. Do not accept a percentage alone.
- Ask four fixed questions: does this cover EU ETS only or also FuelEU compliance cost; which allowance price is it based on and how often is it revised; how is the voyage cost allocated to my container; and is the 50% rule correctly applied to my voyage rather than charging me as though it were intra-EU.
- Build it into your landed cost and your customer pricing. This cost is not going away, and absorbing it by accident simply eats your margin.
- Sanity-check the order of magnitude with a carbon estimator so that an obviously anomalous charge does not pass unnoticed.
- When comparing quotes, insist that every provider shows the emissions line separately, or you are comparing different bundles.
- Look at a carrier’s fleet profile and routing plans. For identical cargo, the gap between carriers on this item is real.
- Model ETS and CBAM separately. Do not try to do both in one spreadsheet.
8. What this means for an exporter
For an exporter of shading fabric and home textiles such as Shaoxing Wanbo, the practical change is that customers increasingly want a clearly broken-down cost estimate by destination port and container type, rather than a single vague landed price. We can provide a freight and emissions surcharge breakdown by destination port, container type and expected sailing at the quotation stage, and help customers fold it into their own retail pricing model. If you are building a cost forecast for Q4 2026 or for 2027 orders, send over the destination ports and expected container volumes and we can work up an initial estimate against the current market structure.